Observability
The Observability Stack uses two tools:
-
Loki
- Arguably the most important tool, logs include customer application data ranging from server performance to your application log data. Grafana uses Loki to store and query logs. Promtail – an agent that collects logs – integrates with Kubernetes, which is where your customer application resides. Promtail collects data from logs along with certain runtime system data.
-
Grafana
- An interactive data visualization platform, Grafana enables you to query your application's log data and – in turn – retrieve query results presented as logs, charts, graphs, and dashboards.
This Observability Stack provides visibility into your application.
Note
This content is specific to a use case that enables customers to understand how Grafana uses their deployed data. The user persona is a client application engineer, and this content represents how someone in this role navigates Grafana to view customer-specific deployed data. Since the user persona represents someone with the capacity to understand technical concepts and terminologies, this content does not provide insight into basic Grafana functions.
Getting Started
You can access Grafana via the Production (PRD) environment using your Platform One (P1) SSO credentials and Government Access Card.
Access Environment
- Access Grafana via Game Warden IL2 PRD.
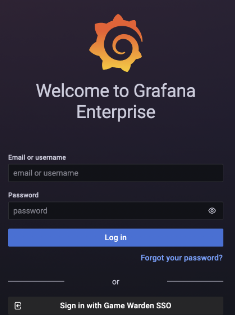
The Welcome to Grafana Enterprise window opens. -
Click Sign in with Game Warden SSO.
-
Enter your P1 login credentials and subsequent Multi-factor Authentication (MFA) code.
After you successfully enter your login credentials, you will have access to the Grafana Home page.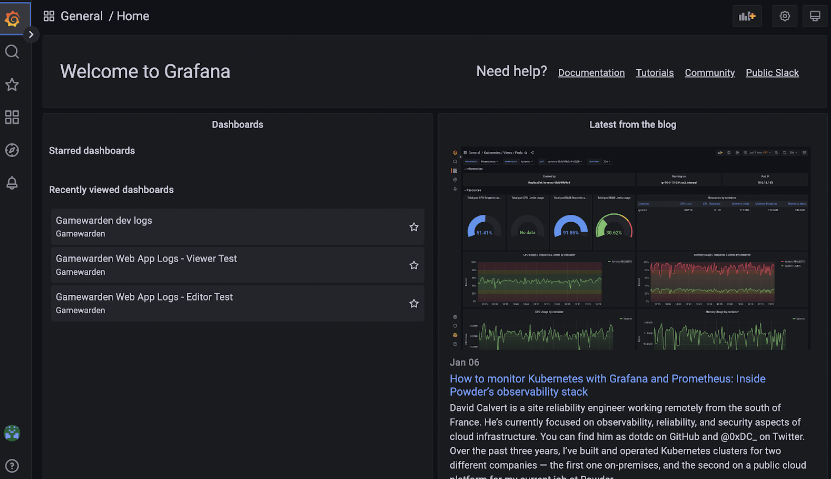
-
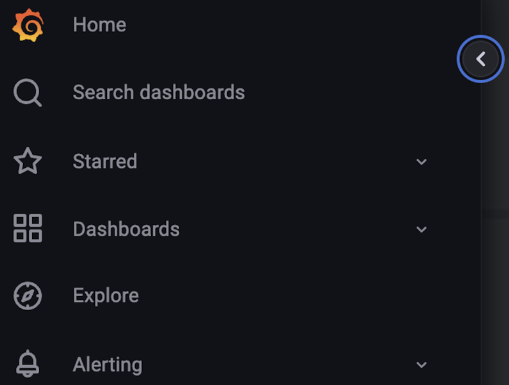
Click the right-facing arrow near the top left pane to expand the navigation area.
Permissions
Customers only have access to dashboards in their folder along with a General folder, which will contain generalized queries and templates developed by the Site Reliability Engineering (SRE) team. The Observability Stack – Loki and Grafana – provides access only to application log data and metrics in your Kubernetes application namespace.
Users are associated with teams. These teams have permission solely to access their customer folder and datasources, which pull data from the Kubernetes clusters into Grafana.
View Dashboards
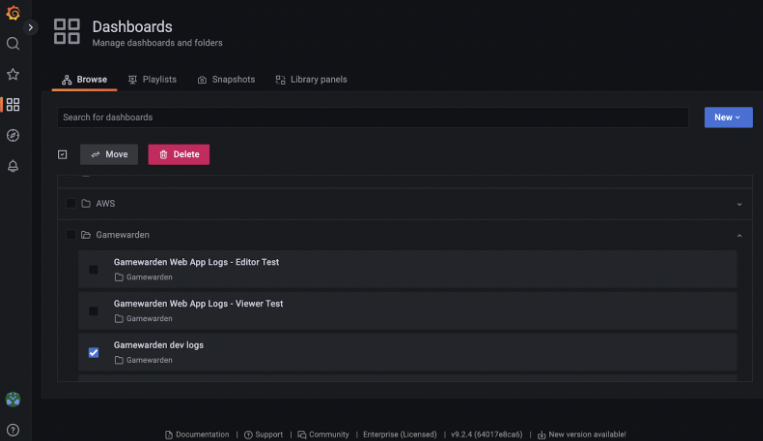
- Select Dashboards | Browse from the left navigation pane.
Grafana displays your customer folder. -
Select your customer folder then choose a dashboard.
-
Double-click the selected dashboard.
Grafana provides a graphical visualization. The related dashboard data and links will vary, as this content is unique to each customer’s application data and services. You can select links near the lower section of the page, if applicable, to view additional panels of data from Docker containers or Kubernetes pods. In some cases, you might have access to logs along with metadata associated with each log entry.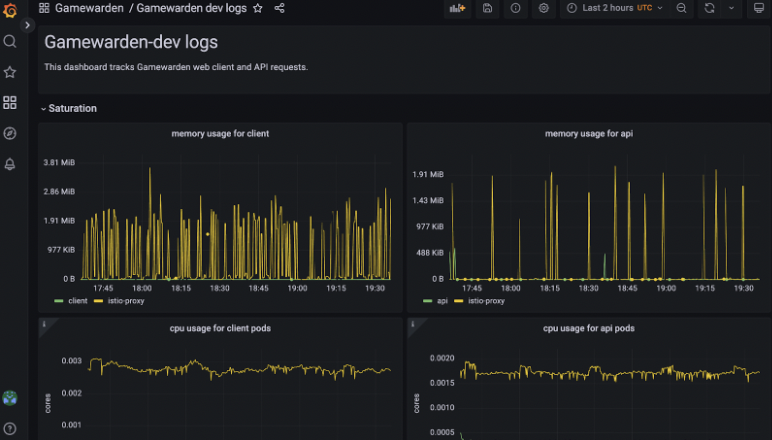
Create Queries and Dashboards
You can create, edit, and execute queries using Explore.
To create queries:
- Select Explore from the left navigation pane.
The Query Editor opens. -
Select the drop-down arrow near the top left section of the page to choose the datasource you want to query if, in fact, you have configured more than one datasource. For example, you can select {ORG}-prd-customer.
-
Create a LogQL query, using format:
{log-stream-selector} | log-pipeline
The stream selector should always include the application namespace and can include additional options. This query section narrows the logs your query searches. The log pipeline contains functions or transformations that are performed on the logs you specify with the stream selector.
EXAMPLE QUERY: This query searches for log entries that contain “400”.
{namespace="YOUR_APPLICATION_NAMESPACE", container="CONTAINER_NAME"} |= '400'
EXAMPLE LOG ENTRY: This entry is in a common access log format (used by nginx).
127.0.0.6 - - [09/Jan/2023:22:40:17 +0000] "POST /api/request-path HTTP/1.1" 400 2 "-" "HTTP-AGENT/1.0.0"
Your application logs must use consistent formats across an application. This allows queries to capture relevant information more easily and ensures no logs are missed by a given query.
You can use fields such as Metrics, Label Filters, Operations, and Legends to help build queries. As you enter information in these fields, Grafana provides auto-complete suggestions based on your input.
-
Review the query statement(s) to ensure accuracy.
- Click Run Query to execute.
Grafana displays the query results on the lower section of the page. - Click Add to Dashboard near the top right of the page.
- Click Open dashboard.
The dashboard opens. - Click the Save dashboard icon near the top right of the page.
- Enter a Dashboard name and use the drop-down arrow to select a Folder.
- Click Save to store changes.
Grafana contains the new dashboard panel. You can search the dashboard name for quick access. You also can view this dashboard on your Home page under Recently viewed dashboards. Here, you can select the Star icon next to the entry, making it a Favorite under Starred dashboards. Starring the dashboards allows faster and more efficient access. - Edit the panel and customize visualization settings as preferred, using the Switch to table and Open visualization suggestions options.
As noted in the steps above, you can create a query and add this query to a dashboard. Similarly, you also can select Dashboards | New dashboard from the left navigation pane on the Home page, add a panel, create a query, then add this query to a new dashboard – repeating most of the previous steps.
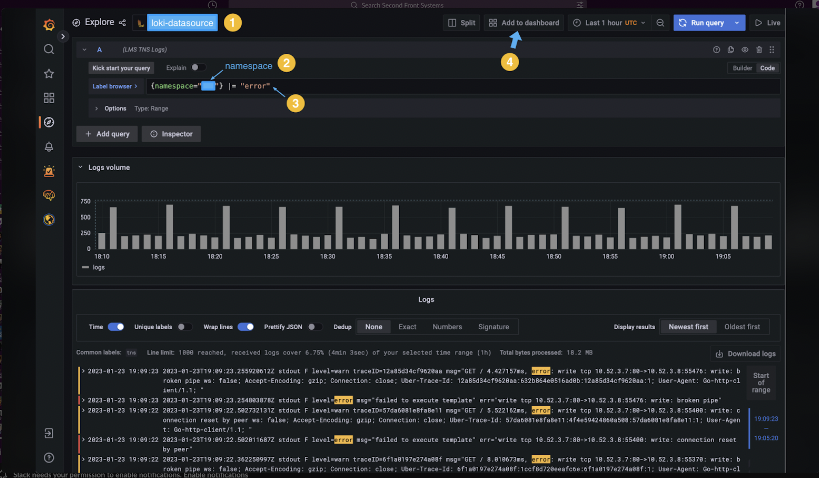
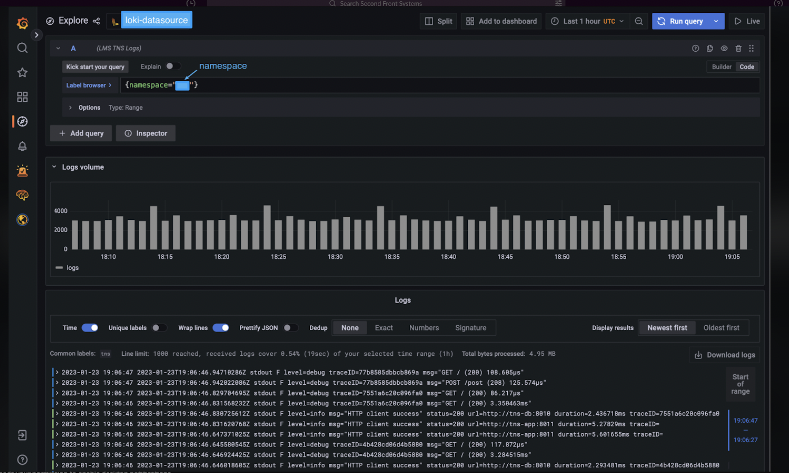
Sample Query Editor Workflow
- Make certain the loki-datasource corresponds to your company’s datasource name. For example: ORG-dev-customer or ORG-prd-customer.
- Enter the namespace that corresponds with your Kubernetes application namespace in the Query Editor text box, which resides next to Label browser.
- Click Add to dashboard to save the query as a panel in your dashboard.
Additional Information and Follow-up
Ticketing Process
You must submit a ticket for a pairing request with an SRE. This ticketing process enables you to ask technical questions about the Grafana usage, log and metrics data, and dashboard customizations.
To submit a ticket see the Support Ticket instructions.
Customer Support
You can submit Pairing Session Requests for troubleshooting support specific to currently deployed observability dashboard functionality. After Observability Onboarding sessions are complete, you can use up to four hours of pairing sessions.
Grafana Reference Links and Resources
You can access the Grafana Documentation to retrieve additional information. You also can access the Grafana site for information specific to Loki and Grafana:
Loki
Grafana
Best Practices
Logging Best Practices
-
Use structured logs
- Enables you to search and analyze data more efficiently.
- Provides log messages in a JSON format or as key-value pairs to make logs easier to parse. Use one of the structured logging packages in the programming language defined by your ecosystem or use key-value pairs.
-
Add log levels, such as Debug, Info, Error, and Warning.
- Standard logging modules in your defined programming language should automatically include the log level with each message. Ensuring the log level exists helps Grafana filter and separate logs by type and severity level.
Observability Best Practices
- Add context information (high cardinality identifiers) to help diagnostics and event tracing.
-
Adding the event or transaction ID to your log messages helps Grafana perform tracing and event correlation.
Event tracing is a feature our SRE team can use to ensure your application performs once the Observability Stack is more mature. Our team will roll out specialized Grafana tooling for this future effort.
-
Last Update: 11/30/23