Observability in Game Warden
Game Warden’s observability stack provides real-time visibility into application behavior, performance, and logs. It leverages the following tools:
Grafana is a data visualization platform that allows you to query, analyze, and visualize your application logs and metrics. With Grafana, you can build interactive dashboards and panels for operational insights into your deployed services.
Grafana also supports log-based alerting, enabling you to set up alerts based on specific log patterns or errors detected in your application.
Loki is the logging backend that stores and queries log data from your application. It collects logs and runtime system data from your containers.
Loki organizes logs into streams and supports powerful querying through LogQL.
Mimir is responsible for metric aggregation, querying, and alerting. It collects and stores time-series metrics from your applications and infrastructure, providing a robust backend for metric-driven insights in Grafana.
Alloy handles the collection of telemetry data across your environment, integrating logs, metrics, and metadata for unified observability.
Note
This guide is intended for application engineers who are already familiar with technical concepts and need to explore customer-specific data within Grafana. It does not cover basic Grafana functionality.
Access Grafana dashboard
Info
Access to Grafana are not granted automatically and must be explicitly assigned. If you were invited by your team, you will receive baseline developer and logging access automatically. If you signed up without a team invitation, or find you are missing Grafana access, contact a 2F administrator to have the appropriate permissions granted to your account.
The Grafana endpoints you’ll use are managed by the Second Front team. Most production endpoints follow the same convention as your AFWERX endpoint:
grafana-<company-id>.il2.afwerx.dso.mil
Note that DEV, STG, and PRD environments each have their own unique URLs. If you need help identifying your specific environment endpoints, contact your Mission Success Manager.
You can access Grafana using your Platform One (P1) SSO credentials and Government Access Card.
- Go to your Game Warden Grafana endpoint and click Sign in with Game Warden SSO.
- On the Log in or sign up page, click Continue With P1 SSO.
- Enter your P1 credentials and Multi-Factor Authentication (MFA) code.
The Grafana endpoints you’ll use are managed by the Second Front team. Most production endpoints follow the same convention as your DISA endpoint:
grafana-<company-id>.il2.2f.mil
Note that DEV, STG, and PRD environments each have their own unique URLs. If you need help identifying your specific environment endpoints, contact your Mission Success Manager.
The Grafana endpoints you’ll use are managed by the Second Front team. Most production endpoints follow the same convention as your FedRAMP endpoint:
grafana-company-id.fedramp.gamewarden.io
Note that DEV, STG, and PRD environments each have their own unique URLs. If you need help identifying your specific environment endpoints, contact your Mission Success Manager.
You can access Grafana using your Game Warden credential.
- Go to your Game Warden Grafana endpoint and click Sign in with Game Warden SSO.
- On the Log in or sign up page, enter the username and password you created during registration.
- Click MFA Log In.
- Enter the current code from your authenticator app and click MFA Log In.
After logging in, you'll be directed to the Grafana dashboard.
Common tasks in Grafana
Review the tabs below for common tasks you'll perform in Grafana.
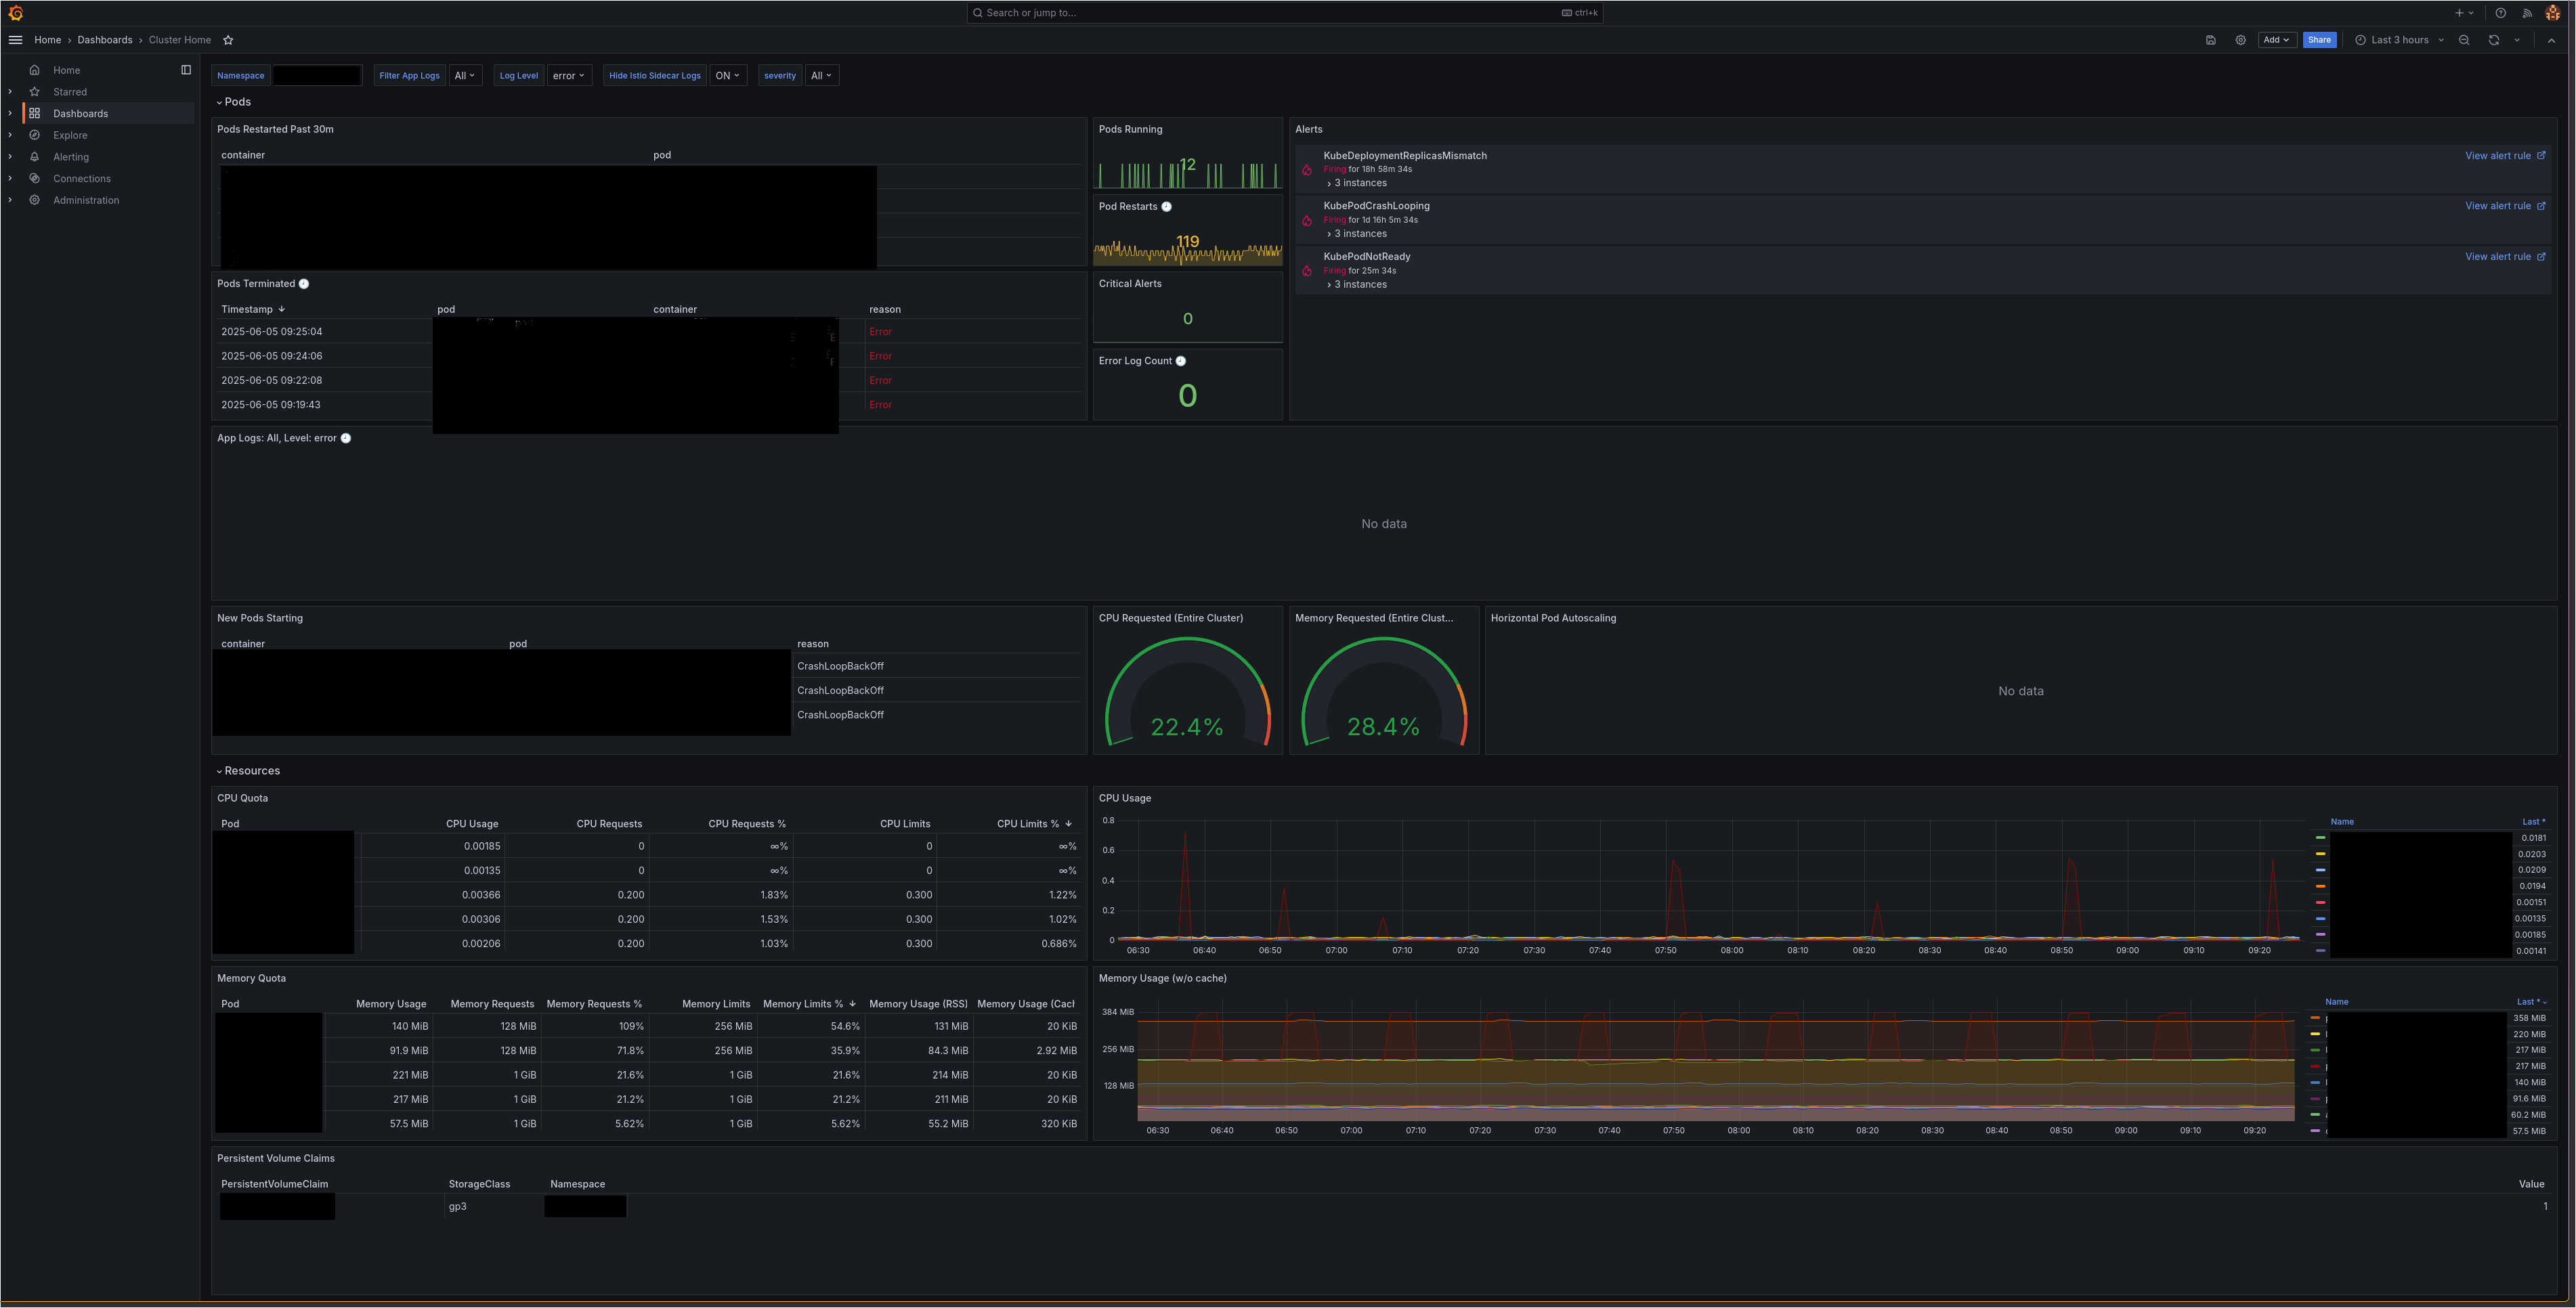
The Grafana home dashboard includes a dedicated Alerts panel to help you monitor which alerts are actively firing within your application namespace.
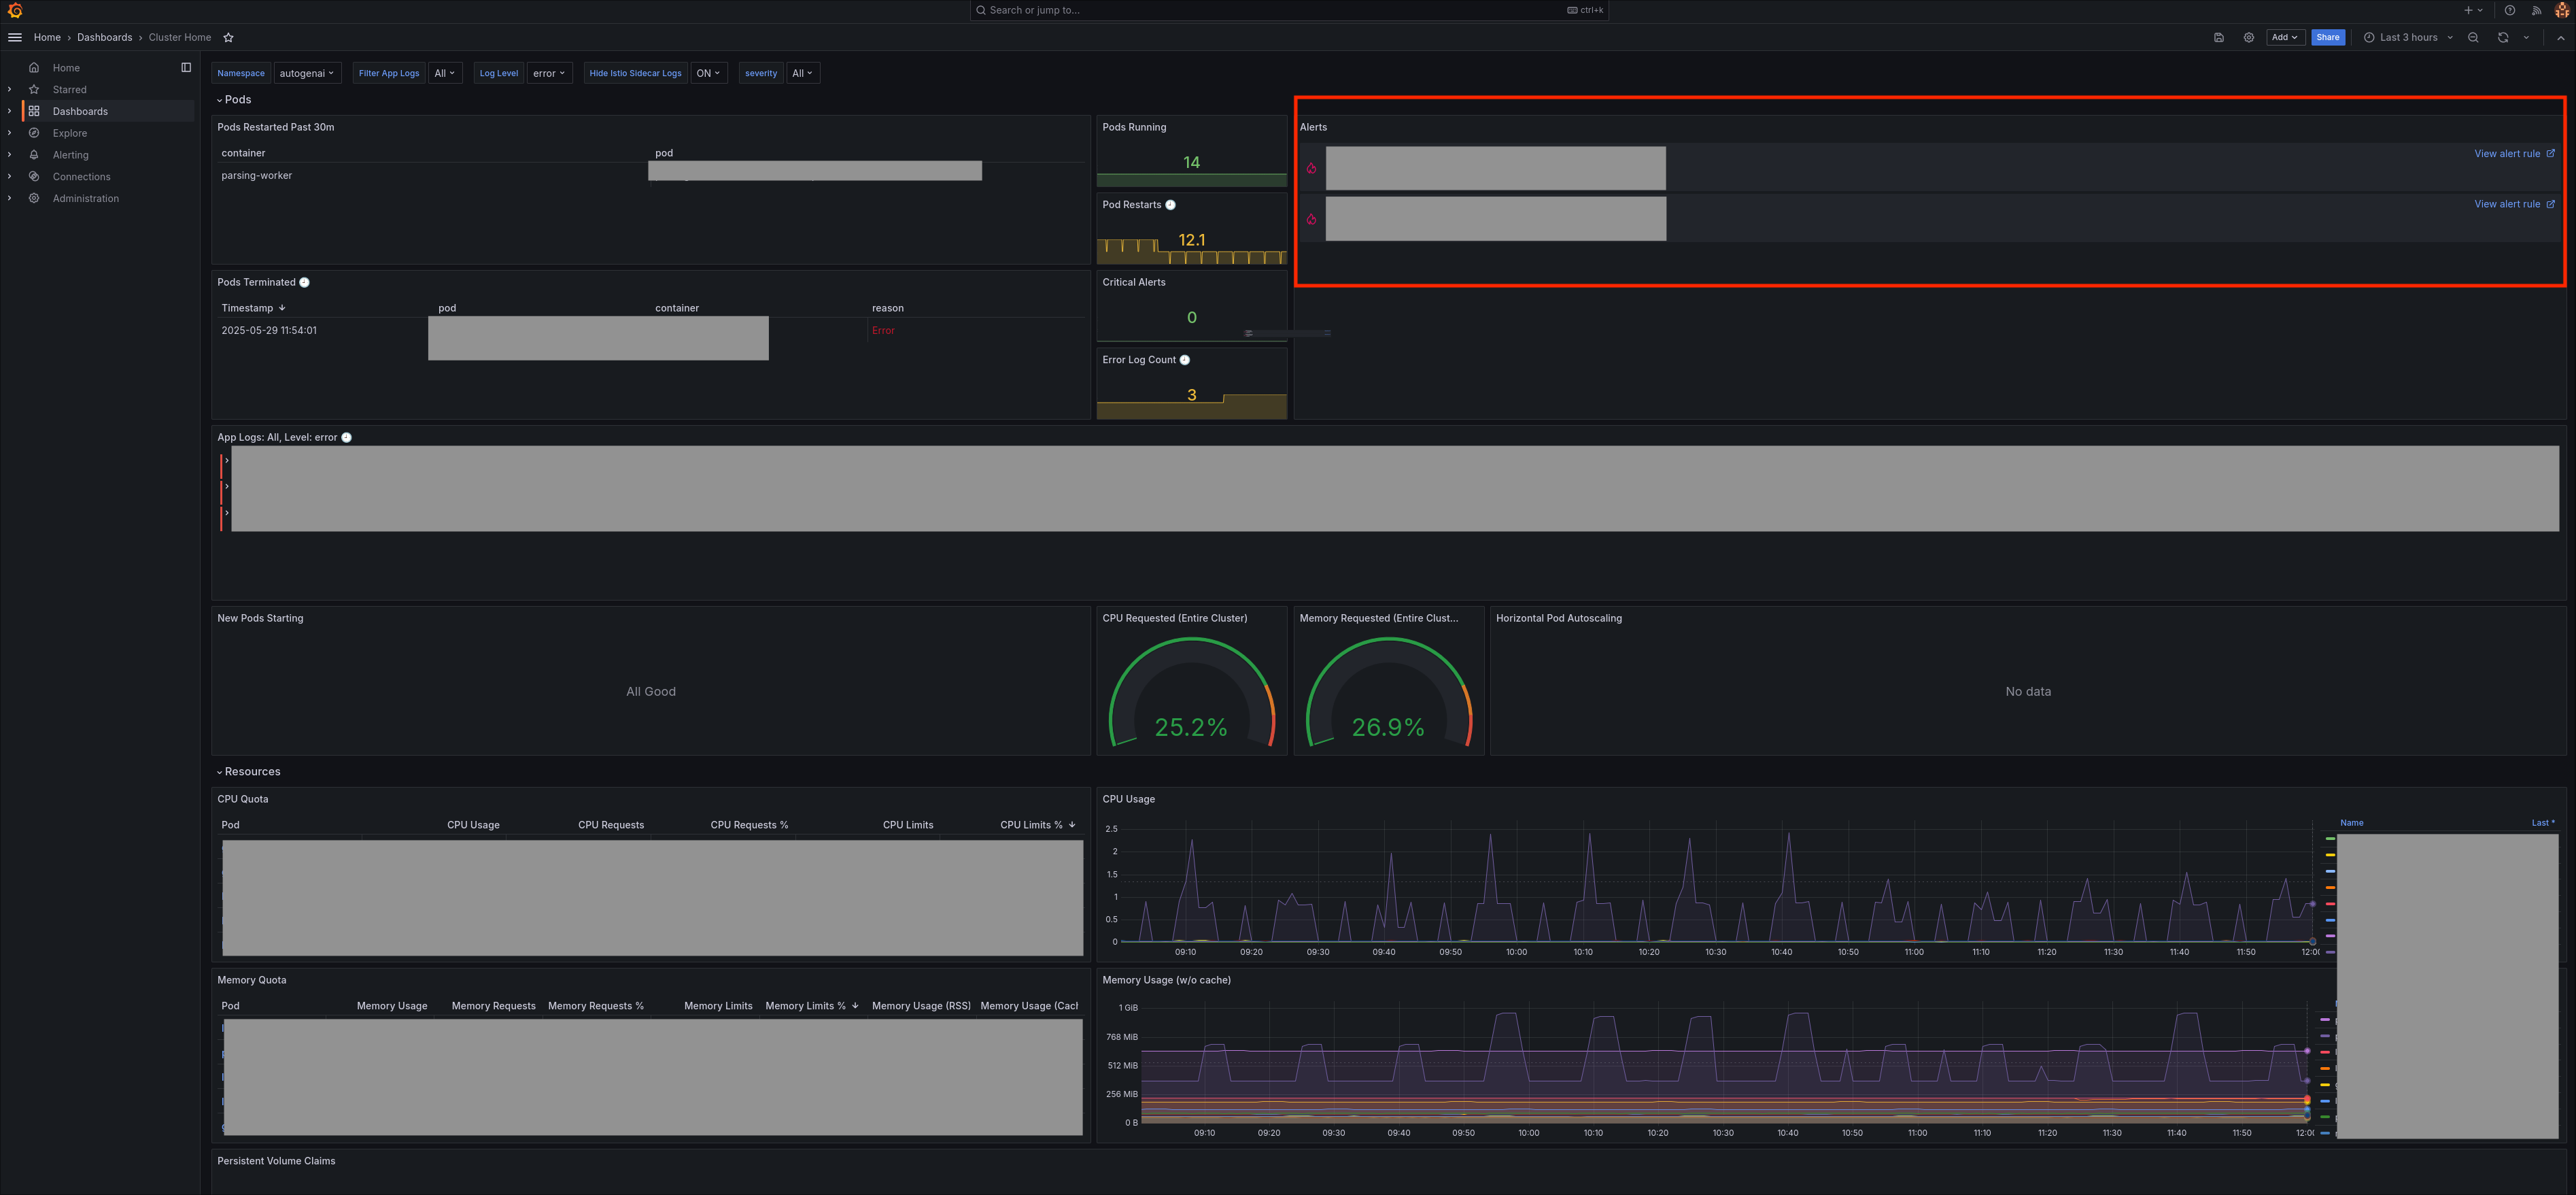
What's included?
The stack includes over 200 preloaded Prometheus alerts and 200+ recording rules for monitoring both application and infrastructure-level behavior. These alerts are also listed on the Alerting page in Grafana.
Tip
For detailed alert descriptions, see the Prometheus runbooks.
Alert behavior
By default, Prometheus-based alerts are configured to send notifications to Slack. Certain alerts—such as those related to Kubernetes control plane components—are automatically silenced in cloud environments, as they are only relevant for bare-metal deployments. As a customer, you will receive alerts that are scoped specifically to your application namespaces. Meanwhile, infrastructure and platform-level alerts are monitored and managed by the Second Front team.
Manage custom alerts
- You cannot modify default Prometheus/Mimir alerts directly (e.g., silencing or adjusting intervals).
- You can create custom Grafana alerts using Grafana's native alert engine:
- These alerts support querying both logs and metrics.
- A one-time configuration by Second Front is required to route custom alerts to Slack.
Using the Query Editor (Explore)
- In the left navigation pane, go to Explore > Queries.
- Select your datasource from the top-left dropdown (e.g.,
ORG-prd-customer). -
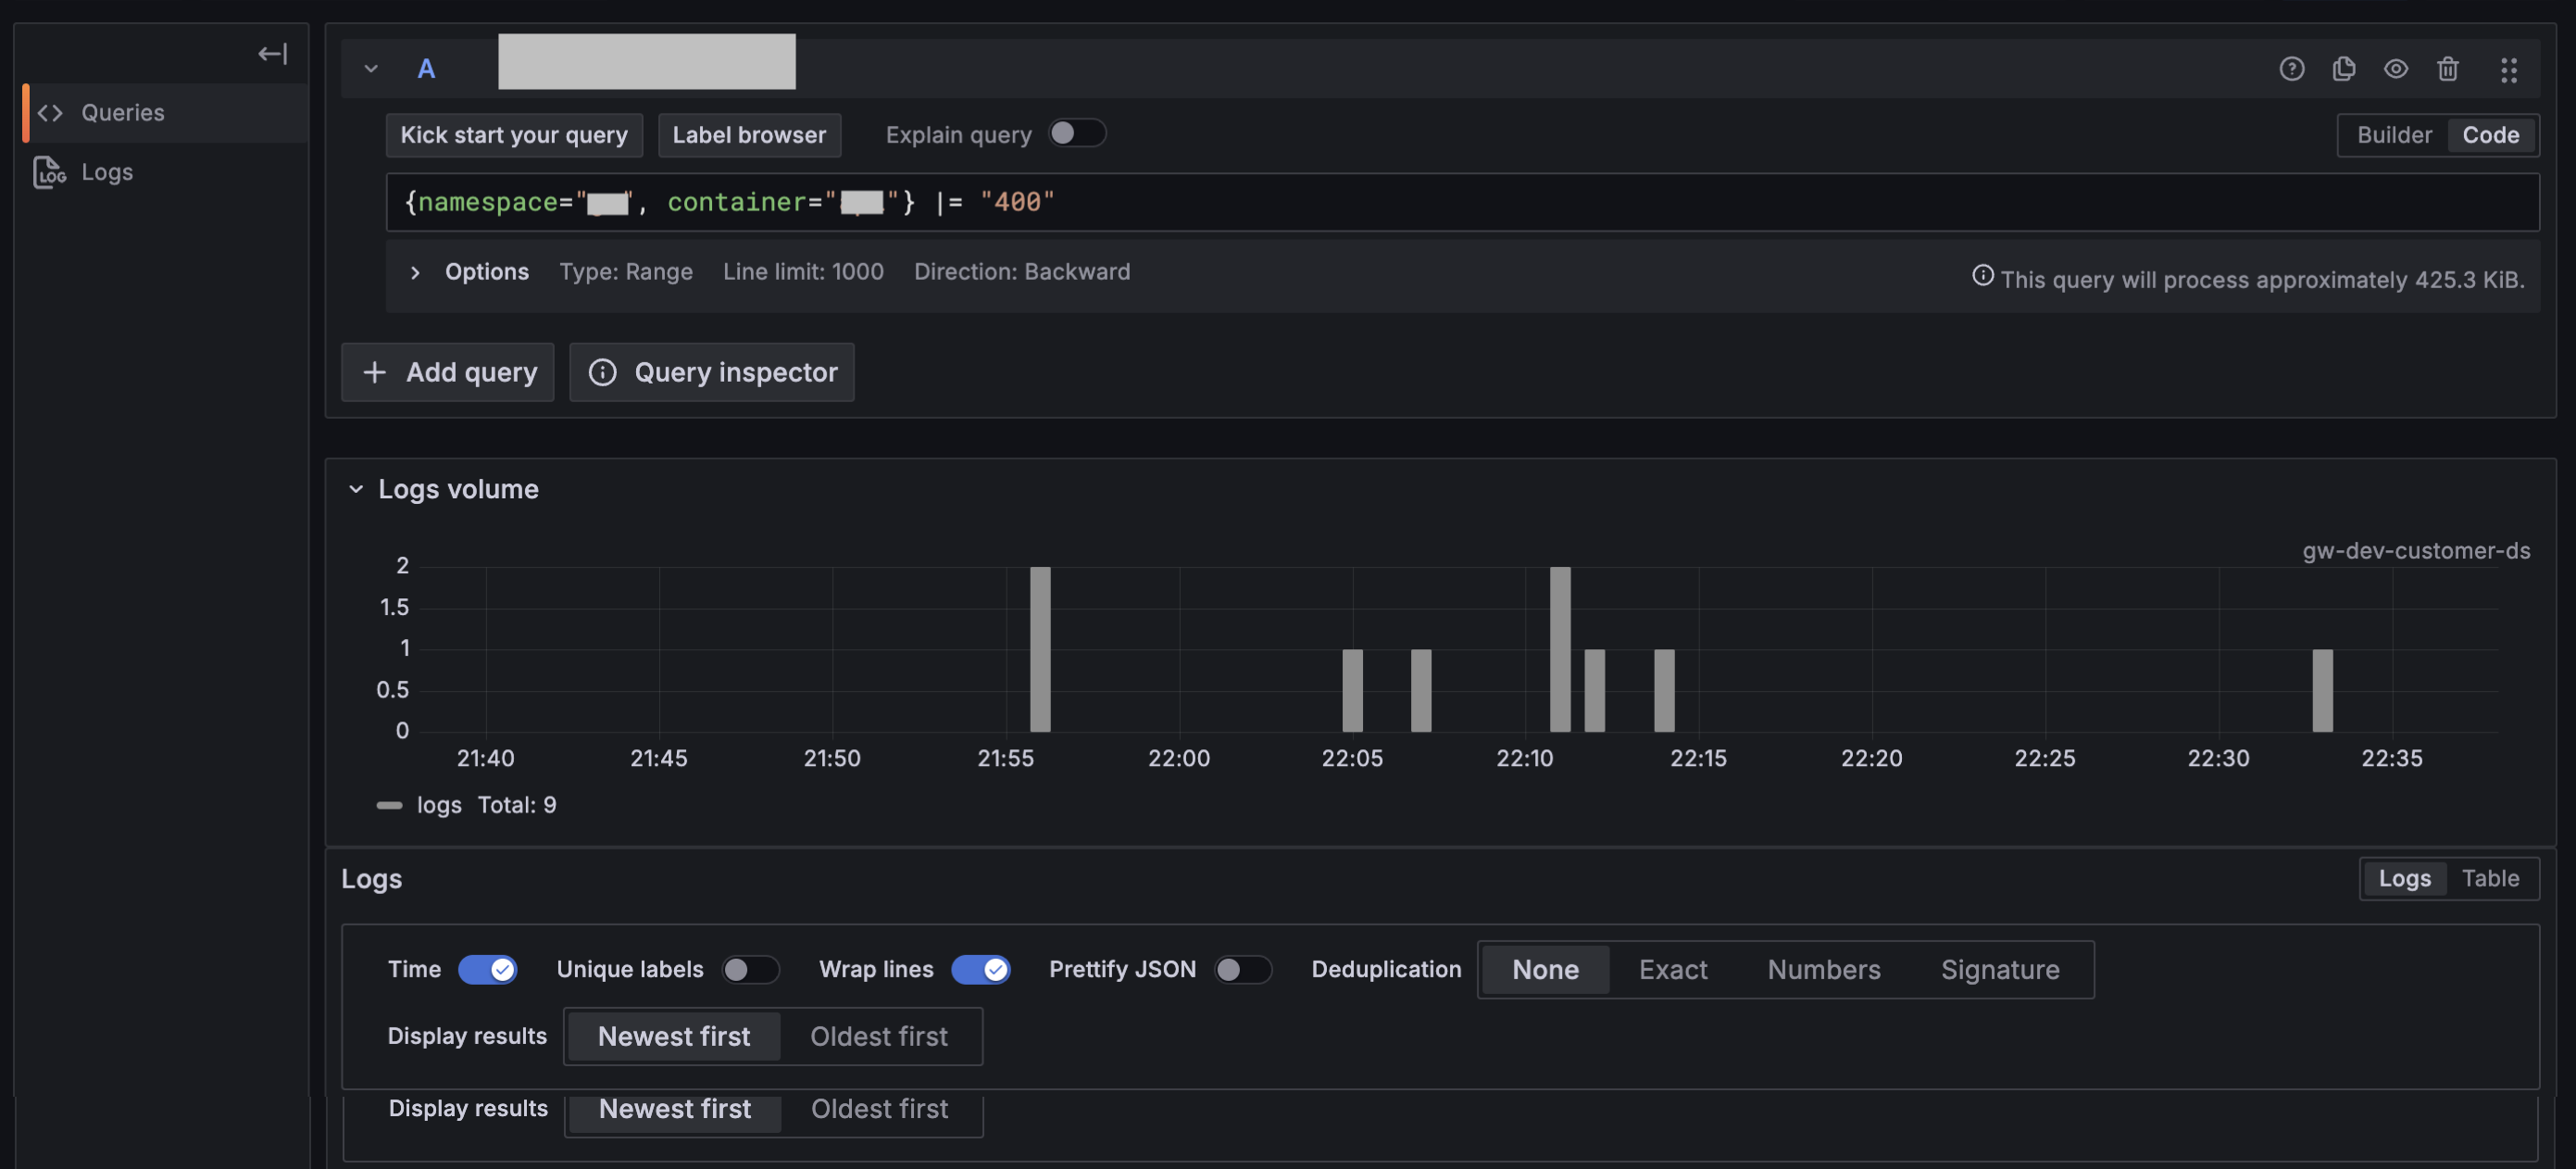
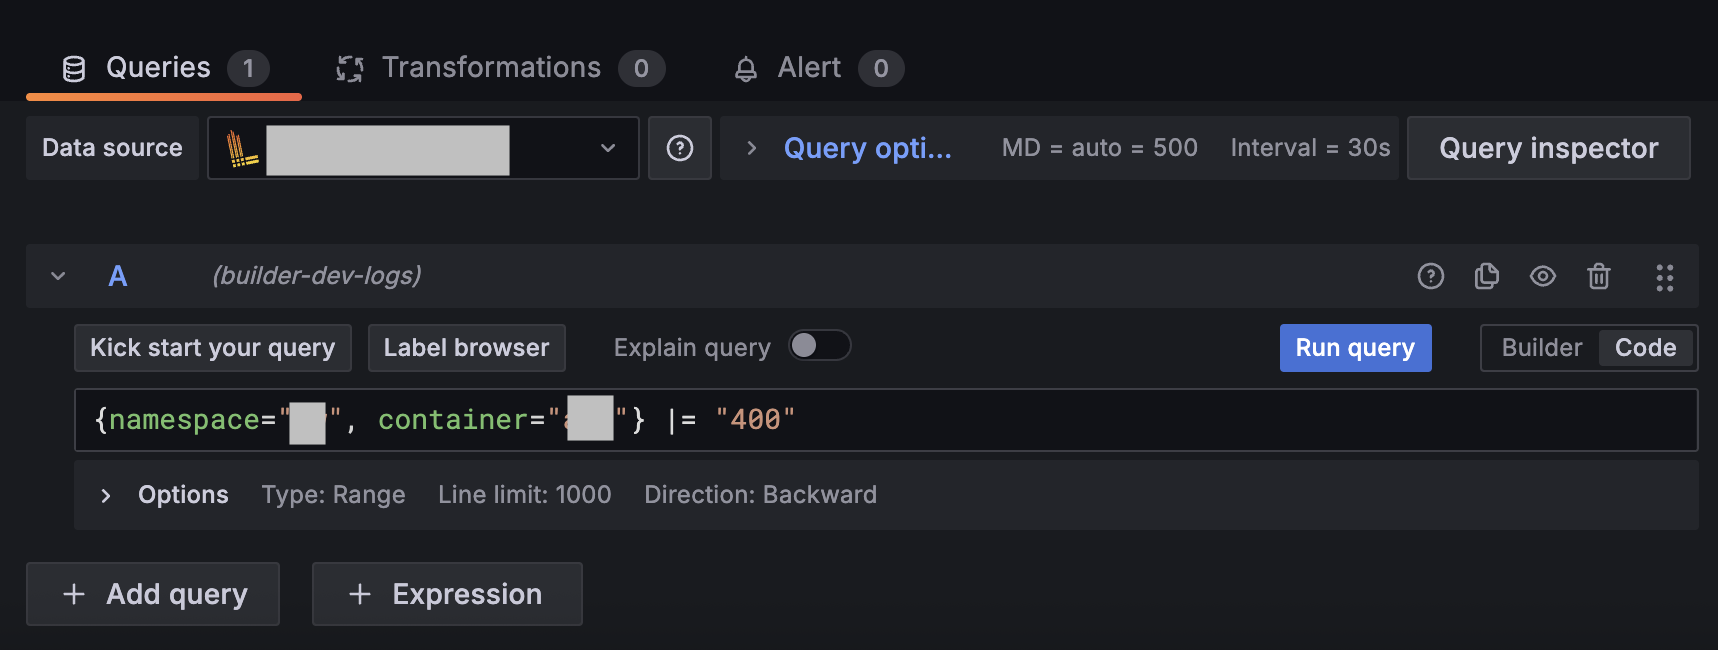
Toggle the Builder/Code option to Code. This allows you to write a LogQL query using the following format:
{log-stream-selector} | log-pipelineFor example, this query retrieves log entries containing the HTTP 400 error code:
{namespace="YOUR_APPLICATION_NAMESPACE", container="CONTAINER_NAME"} |= "400"And this entry is a common access log format, often generated by web servers like Nginx or Apache:
127.0.0.6 - - [09/Jan/2023:22:40:17 +0000] "POST /api/request-path HTTP/1.1" 400 2 "-" "HTTP-AGENT/1.0.0" -
You can toggle to the Builder UI and use fields such as Metrics, Label Filters, Operations, and Legends to help construct your query. Grafana provides auto-complete suggestions as you enter information.
-
In Code view, you’ll also find a Label browser button (for log datasources) or a Metrics browser button (for metrics datasources).
-
Click Run Query (located to the left of the Live button) to view results.
-
Click Add > Add to dashboard and choose whether to open the query results in an existing or new dashboard, then click Open dashboard.
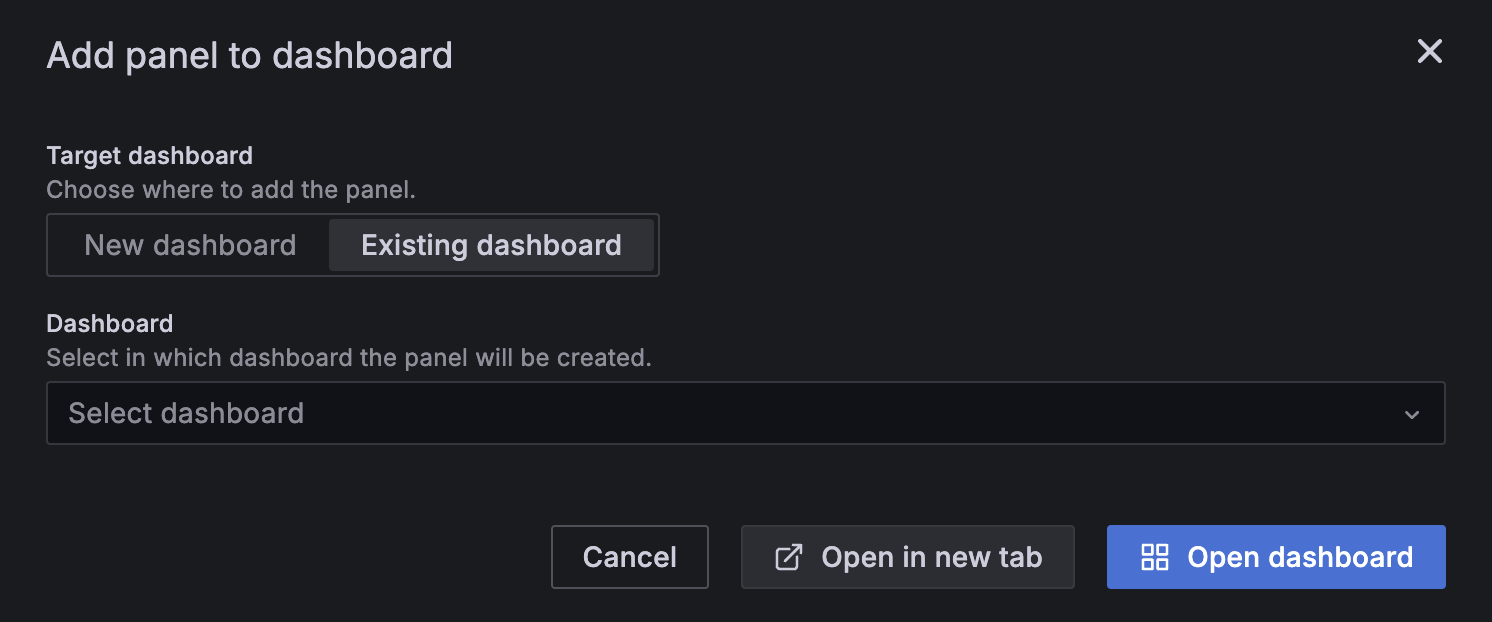
-
Click Save dashboard, provide a name and select a folder location. You can star the dashboard later for quick access.
Tip
Ensure log formats are consistent across your application to improve query reliability and log parsing.
Create dashboards
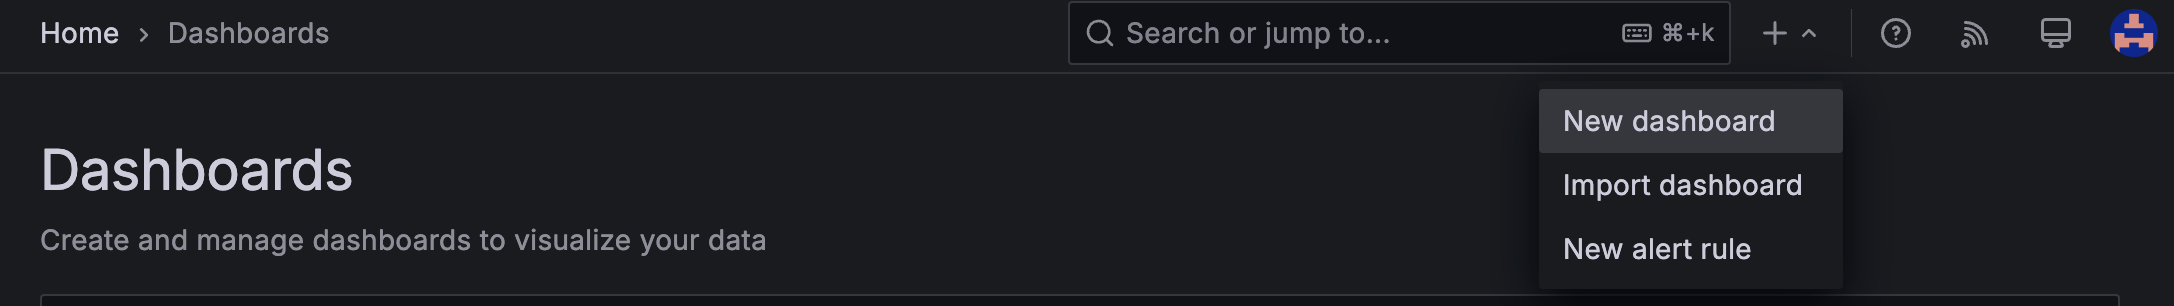
-
In the left navigation pane, go to Dashboard > New dashboard.
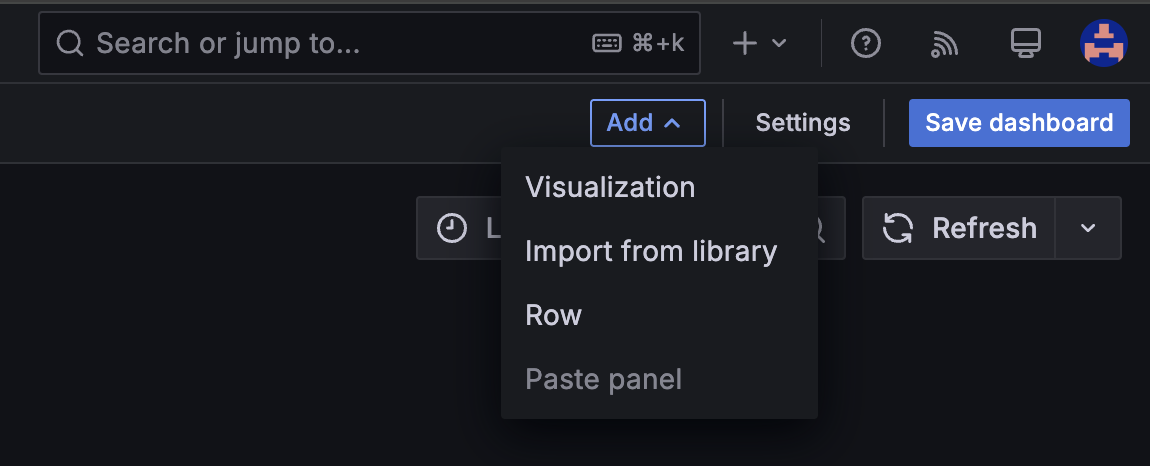
-
From the Add dropdown in the top-right corner, select Visualization.
-
Select your datasource from the top-left dropdown (e.g.,
ORG-prd-customer). -
Create a query, then click Run query.
-
Click Save dashboard, then provide a name and select a folder location. You can star the dashboard later for quick access.
Troubleshooting: Example scenarios
Below are two common scenarios that highlight the importance of checking beyond container logs and incorporating Istio traffic and authentication insights in your troubleshooting process.
When traffic is completely absent from your service, it’s often due to either an authentication issue or an Istio-related networking issue.
In Kubernetes clusters, while you can use container logs to look at service-specific events, much of the networking flow occurs through Istio sidecars. These sidecars act as independent containers within your pods and are not always reflected in the main container logs.
To investigate, go to the Explorer page in Grafana and query logs based on the destination of the virtual service in question.
For example, if the service name is api, query logs for Istio interactions and virtual service forwarding. Below is an example LogQL query:
{namespace="YOUR_NAMESPACE", container="istio-proxy"} |= "api"
{namespace="YOUR_NAMESPACE", container="istio-proxy"}=> This targets logs from the Istio sidecar (istio-proxy) within your namespace.|= "api"=> Filters the logs to include entries that mention "api", which is typically how the virtual service or destination service would appear in the logs.
Look for log entries such as no_healthy_upstream, which suggests that traffic is not reaching a healthy endpoint or is being blocked by Istio.

These logs can arise due to:
- Destination endpoint issues (e.g., the target service is unavailable or misconfigured).
- Istio routing rules that do not match the intended destination.
Game Warden deploys a cluster-wide authentication service called authservice, which manages traffic authorization based on rules defined for each application.
When traffic is blocked due to authentication issues, you’ll see log entries indicating failed authentication attempts, often using codes such as UAEX ext_authz_denied.

To troubleshoot:
- Use namespace-scoped queries in Grafana to capture logs from all relevant services, not just individual containers.
- Look for authentication errors in logs and identify which service or token is failing the checks.
- Determine if the authorization policies need to be adjusted or if authservice rules need updates to accommodate new traffic patterns.
Best practices for troubleshooting
- While container-scoped logs are helpful for isolating issues in a specific service, using namespace-scoped logs provides better visibility into how services interact—especially for traffic routing and authentication flows.
- In most cases, start with namespace-scoped queries to understand the full service communication context, and narrow down to container logs only when investigating a specific process or isolated error.
Best practices
Use structured logs:
- Format log messages as JSON or key-value pairs to make them easier to parse and analyze.
- Structured logging improves searchability, enables more precise queries, and ensures compatibility with observability tools like Loki and Grafana.
- Use structured logging libraries available in your programming language or implement consistent key-value formatting.
Include log levels:
- Incorporate standard log levels such as
DEBUG,INFO,WARNING, andERROR. - Most logging libraries include log levels automatically. Make sure these levels are not stripped out or suppressed in production logs.
- Log levels allow Grafana to filter logs by severity, helping you quickly focus on critical issues.
Balance logs and metrics:
- If you’re frequently logging an
INFO-level message just to track the frequency of an event, consider creating a metric instead. - Metrics (like counters and gauges) are more efficient for monitoring event counts and trends over time, while logs should focus on diagnostics and warnings.
- Reserve logs for events that need investigation (e.g., unexpected errors or critical warnings).
We recommend integrating the Prometheus client library into your application to expose a /metrics endpoint. This enables:
- Collection of custom application metrics to complement your logs.
- Monitoring of event frequency, performance, and other key indicators directly in Grafana.
More guidance on integrating metrics and setting up the /metrics endpoint will be added soon.
Add contextual information:
- Enrich log entries with high-cardinality identifiers such as event IDs, transaction IDs, or user IDs.
- These identifiers support traceability and make it easier to correlate logs across services and requests.
Prepare for event tracing:
- Adding this contextual information now lays the groundwork for event tracing—a feature our SRE team will support as the observability stack matures.
- Specialized Grafana tooling for distributed tracing will be introduced in future updates to help monitor end-to-end application performance.
Support and resources
To request technical assistance or customizations:
- Submit a pairing session request via the Support Ticketing system.
- After onboarding, customers receive up to four hours of pairing support for observability-related issues.
Loki
Grafana
- Getting Started with Grafana Dashboard Design
- Grafana Webinars and Videos
- Grafana Dashboards/Grafana Play Home
- Grafana Tutorials
- Awesome Grafana
Metrics (Prometheus and PromQL)
- Writing PromQL Queries
- Creating Prometheus Alerts
- Best Practices for Prometheus Alerting
- Setting up a /metrics Endpoint (Prometheus Docs)